Low-Stakes, High-Value Assessment Systems
Explorations in computer fundamentals and Java programming
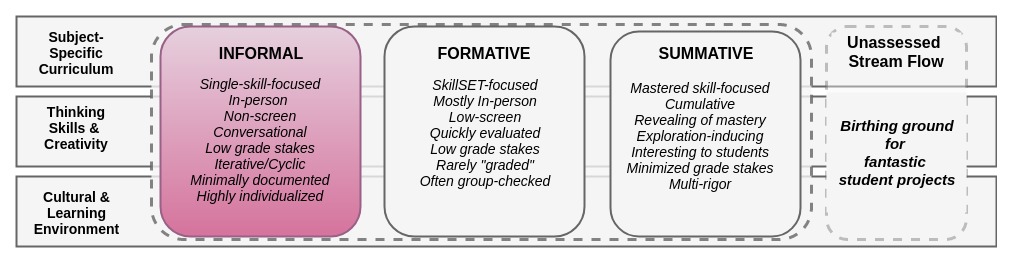
This document describes an assessment system that expands the traditionally test-centered approach to include informal, frequent micro-assessments and expand the use of formative tools.
| Informal | Formative | Summative |
|---|---|---|
|
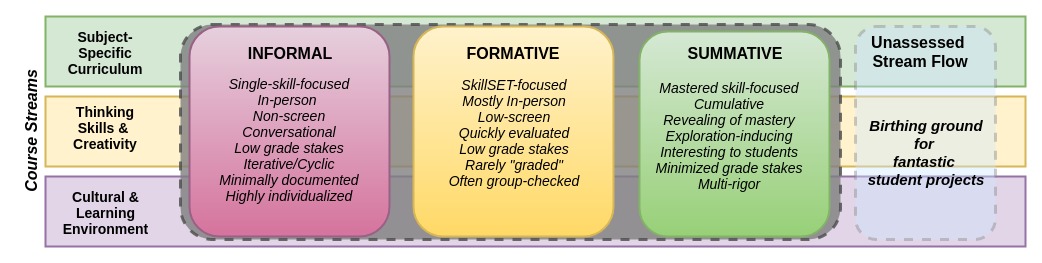
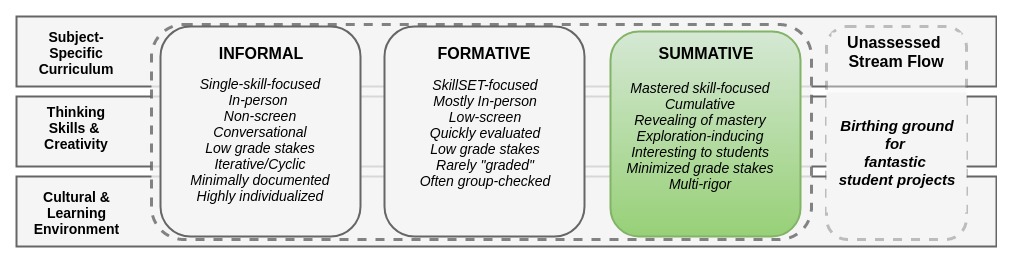
Focus: Single skill Reference: Activity /exercise In-person & Non-screen Conversational Low-stakes Iterative/Cyclic Minimally documented Highly individualized |
Focus: Bundle of skills Reference: Lesson Mostly In-person & Low-screen Quickly evaluated & returned Rarely "graded" for points Group-checked when possible Often lesson-based |
Focus: Mastered skills Reference: Unit Minimized stakes Cumulative Revealing of mastery Exploration-inducing Interesting to students Multi-rigor |
| Example: Circulating the room, inviting students to explain various elements of an in-process flow-chart of a computer motherboard. Offering micro-feedback as one walks around. Could be called: Assessment By Walking Around (ABWA) | Example: Asking students to write 1-3 lines of Java code which capture the essence of a lesson on method calls on a 1/4 sheet of paper. Scanning those slips as they're turned in. Offer group and individual feedback at the start of the next class. | Example: |
Jump to a section:
Thinking framework
System design rationale: Critique of test-centered assessment
Diagrammatic model of assessment system
Case study module overview
Role of system diagramming in technical fields
Links to companion documents
Comparing summative-driven and formative-driven assessment models
Assessment tools explored:
Informal assessment profiles & student work artifacts
Formative assessments profiles & student work artifacts
Summative assessments profiles & student work artifacts
Supporting sections:
Ideas for future system development
Theoretical influences and additional reading
In defense of documentation
Author background
System design rationale: Critique of test-centered assessment
Many teachers root their assesment systems in a schedule of high-stakes, class-standardized quizzes, tests, and exams. While potentially a useful tool for certification and formal skill evaluations, exam-based courses often induce unproductive stress as well as a cycle of binge-studying and information dumping.
Class-standardized instruments administered in introductory courses also tend to either frustrate lower-proficiency students or fail to challenge higher-performing students.
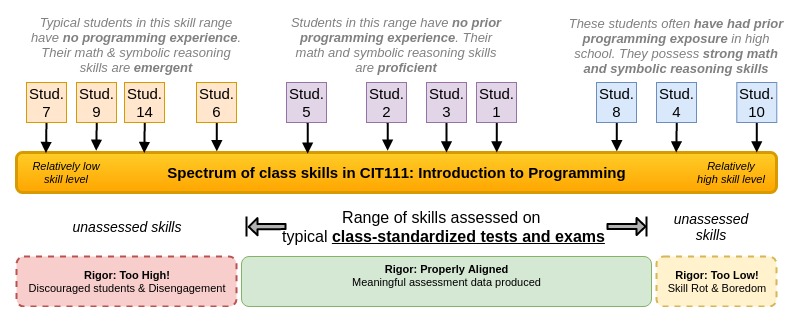
The following document outlines an assessment system built around low-stakes assessment tools which yield frequent, high-resolution data that can actively influence how we can best guide our students' learning process. By centering assessments around a handful knowledge and skill sets which are central to our course, we can draw insight from our assessment data cumulatively as we "spiral up" the rigor of practice.
Diagrammatic model of assessment system
Case study module overview
Module Objectives
Our discussion of assessment tools is based on the development of a course module (i.e. a mini-unit) which was scheduled over three 1.5-hour class periods. The objectives of the lesson module are included in the opening of the module guide and are listed below:
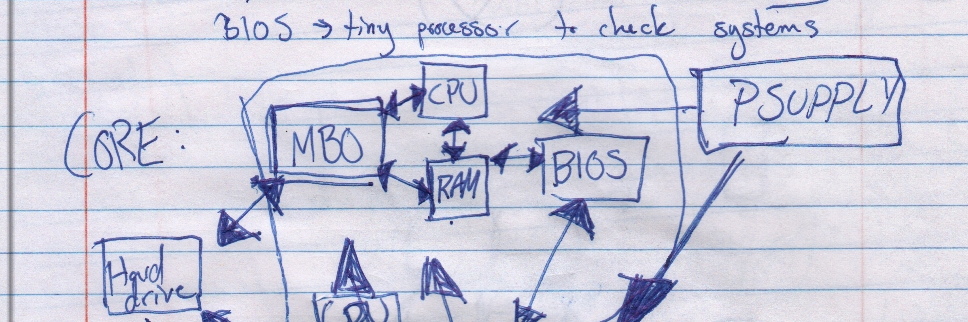
- Describe the function of each core computer component in terms of the role it plays in routing and processing digital data
- Illustrate the relationship between each core computer component using a system diagram (components and flow relationships)
- Discuss the value of determining system “bottlenecks” for improving how a system works.
Discussion of objectives
This module took final form through a few attempts at teaching the function and relationships of computer components less successfully than described in this document.
Informal assessment data gathered during a more traditional instruction-at-board approach suggested that fundamental thinking skills in terms of system diagramming and component relationships was not strong enough to support the modeling of computer components with which the students were not at all familiar.
Objective 1 demands an understanding of both what computer components do and how their basic input --> output structure allows them to connect to other components in the overall system. The requirement to frame the component's role in transferring digital data requires a general understanding of what kind of tasks are actually underway inside the components being modeled.
Objective 2 is the core objective discussed in this case study: students are asked to use a system diagram to describe their knowledge of computer components. We could describe this objective as a "composite" aim because students must combine knowledge of component functions with the skill of conceptually modeling relationships between components.
Objective 3 asks students to synthesize their knowledge of a computer system and its constituent components and their skill of system diagramming to generate an explanation for a computer behavior, known as bottlenecking. This third objective is assessed directly in the module's summative assessment.
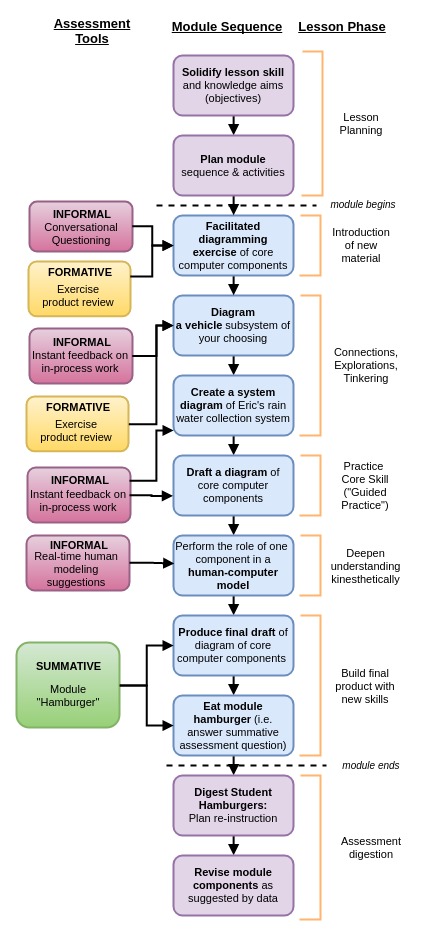
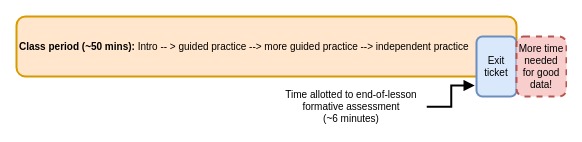
Diagram of module flow and applied assessment tools
The following diagram depicts the planning and execution sequence of the computer component module alongside the assessment scheme used during the module. The sequence flow of the module is depicted in rounded boxes down the center of the diagram. Those sequence items are grouped into more traditionally known lesson phases that roughly correspond to the three classic lesson phases: teacher presentation ("I do"), supported/guided student practice ("We Do"), and independent student exploration ("You Do").
Section 2: Informal assessment profiles & student work artifacts
2A: Summary of Informal Strategies
| Tool Use Example | Summary of data | Impact on course execution |
|---|---|---|
|
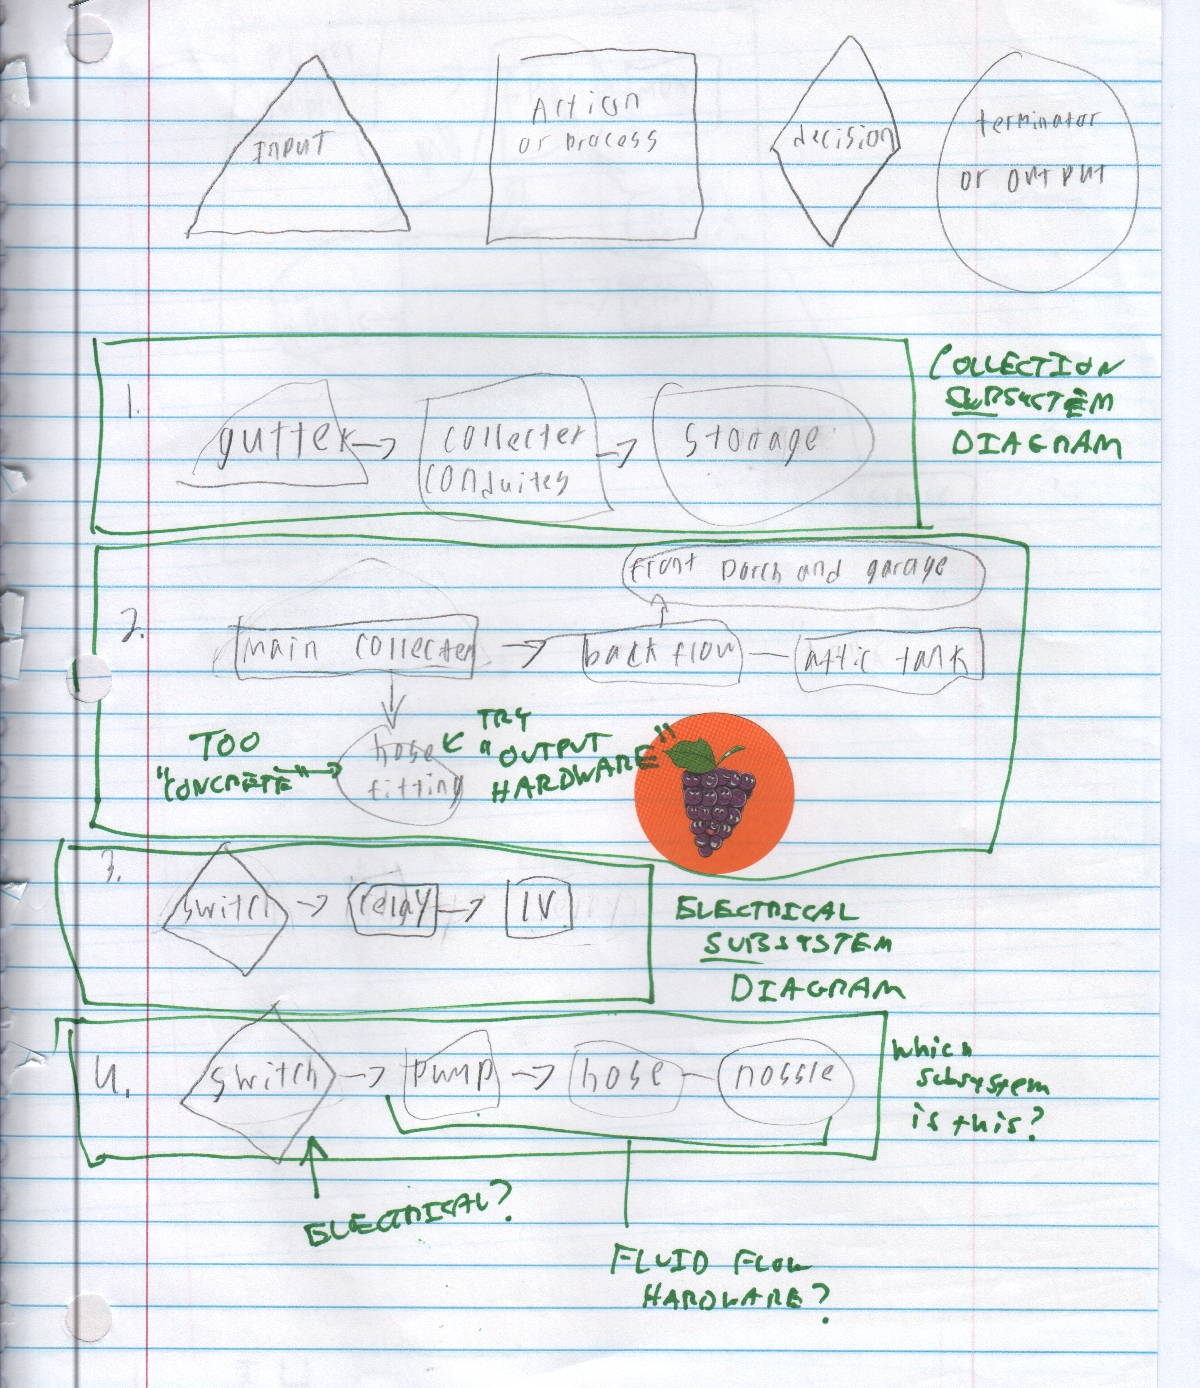
Example 1: Identifying flows in system diagrams Circulating the room as students designed their system diagrams. Asking the question: What components is this part connected to? What stuff is flowing between them? How can we show the flow on the diagram? |
Most students were comfortable connecting components in a diagram with a line, but many fewer had declared what, exactly, was flowing between them. Additionally, many students who were diagramming a car were not isolating a particular sub-system in their diagrams: brakes were linked with a line to the engine, for example. | Designed a system diagramming exercise using my rainwater catchment system which involved explicit flow of water and electricity. Water flows in pipes, and electricity flows in wires. Students watched a series of videos of me showing and describing various subcomponents of the rain water system. Students diagrammed each sub-system during the videos and revised their diagrams at the conclusion of the exercise. Check out the system diagramming guide used in this activity. |
| Example 2: Method calls in Java Responding to a student question in Java about why the code they had just written was not being executed by the compiler. I turned this question into a mini informal assessment with the following questions: "What is the only method that the compiler runs without any further instruction from the programmer?"" (the main() method). "If the compiler only runs main(), how can we direct the compiler to run this other block of code you placed in its own method?" |
The student was familiar with the concept of a method call, but had not internalized the relationship between the concept of a method call and the sequential execution of java code through various methods. I had learned through previous informal assessment that the student gets overwhelmed by non-linear program flow. | Designed a diagram for mapping method calls and flow of execution that attempts to show the transfer of data from method to method through method parameters and return values. Check out the method diagram designed in response to this assessment data. |
2B: Instrument examples and results
These abbreviated examples show evidence of the student work assessed during informal assessment tools and, where possible, include examples of revised student work based on the immediate feedback of the informal assessment.
2Biii: Car system diagram: informal assessment and feedback
One exercise in the module sequence requested that the students draw a system diagram of a vehicle. We started with an open-ended task to simple "diagram a car" and iteratively moved into diagramming a single subsystem of a vehicle with flows between components.
I provided individualized feedback to the student who created this car diagram which encouraged the labeling of what, exactly, is flowing between components in the car?
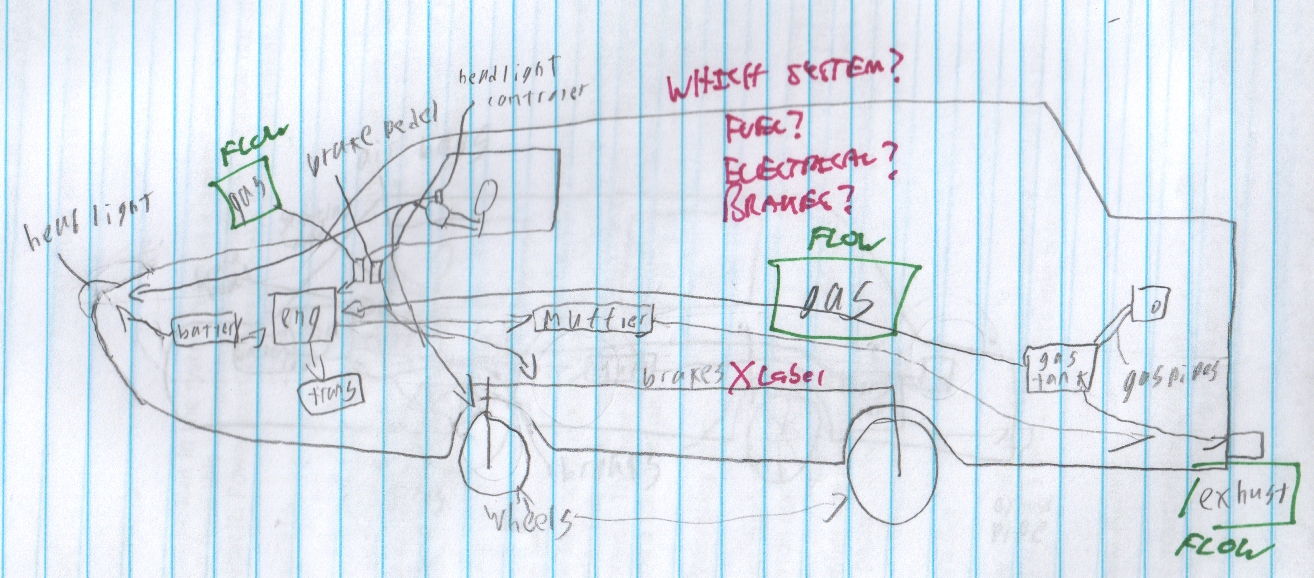
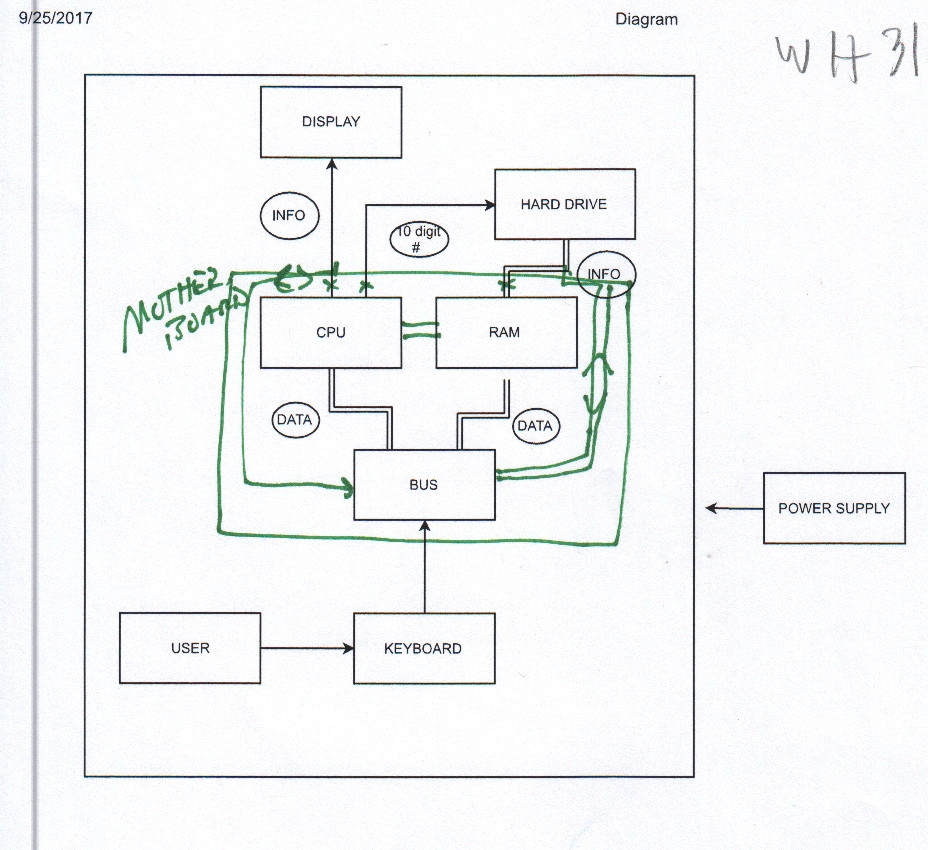
Based on this feedback that was given during an informal, one-on-one assessment, we can see that the student internalized the principle of including what is flowing in a flow chart diagram. The ultimate goal of this lesson was to create a flow diagram of the core components of a computer system. The artifact below shows the same student who drew the car correctly and thoroughly labeled the flows between computer components
Formative assessment profiles & student work artifacts
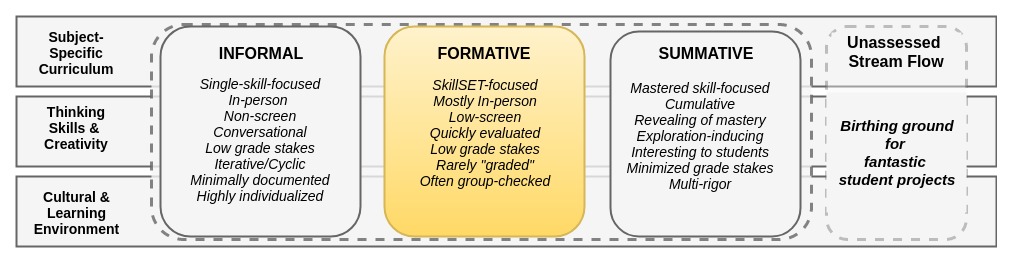
Formative assessments are handy tools for "snap-shotting" student progress at the conclusion of a discrete lesson activity. In our case study, I reviewed student work produced during various exercises in the module to tweak how I implemented the next item in the sequence. This section discusses formative assessments theoretically and then walks through student data I gathered using formative assessment tools.
The good ole' exit ticket corrupts formative assessments: A example from high school
Quite a few secondary lesson models involve the collection of formative data in the form of end-of-lesson snap shots, often called "exit tickets". This is an apt name and probably hails from the shared teacher experience of confronting a rush of high schoolers trying to turn in their mini-quizzes to earn their permission to exit the classroom and scurry off to their next period class in the alloted three minutes and zero seconds.
I share this bleak anecdote from the navigation of packed high school schedules to illustrate how perfectly wonderful assessment strategies can be corrupted by their institutional and instructional context.
If students feel "rushed" in working through an assessment tool, the experience for the student was probably unpleasant--which is toxic to meaningful learning. Since this was a consistent experience of my students in my and many other classes, I needed to have revised my approach. (This document showcases that now-tardy revision.)
From a data perspective, my instrument validity plummeted when my students completed them while hurried and distracted.
My formative assessment system also was administratively broken: By requiring students to turn in their exit tickets at the end of each class session, I accumulated (in a very ugly pile) upwards of a hundred of these one-page quizzes over the course of a single day of teaching. The documentation process alone was tedious and breathtakingly time consuming.
At the request of the school administration, I was requested to score and document each student's proficiency rating in a spreadsheet, which was later scrutinized by my manager. This meant the quizzes had become high stakes for the students and for me--which unnecessarily strains the organic process of learning and teaching. Finally: the graded instruments were (rightfully, indeed) supposed to have been passed back to students the very next class session. Rarely could I or my many of my colleagues keep this boat afloat. The tools were reduced to the rubble of administrative annoyance.
After transitioning out of secondary education, I vowed to never again lay my eyes upon another exit ticket. This document is, in effect, about the revival of the formative assessment's spirit, leaving behind my poor implementation of this tool while teaching at the secondary level.
Formative assessment strategies for the post-secondary teacher
We can check on the progress of students on a lesson-by-lesson basis in a way that yields useful data and does not frustrate us or students. The following table summarizes a few such strategies.
Summary of Formative Strategies
| Tool Use Example | Summary of data | Impact on course execution |
|---|---|---|
|
Example 1: Baking formative assessment tools into lesson activities Ask students to create a system diagram based on the information gleaned from watching the video-taped system tour. Students submitted their diagrams through their portfolio folders. |
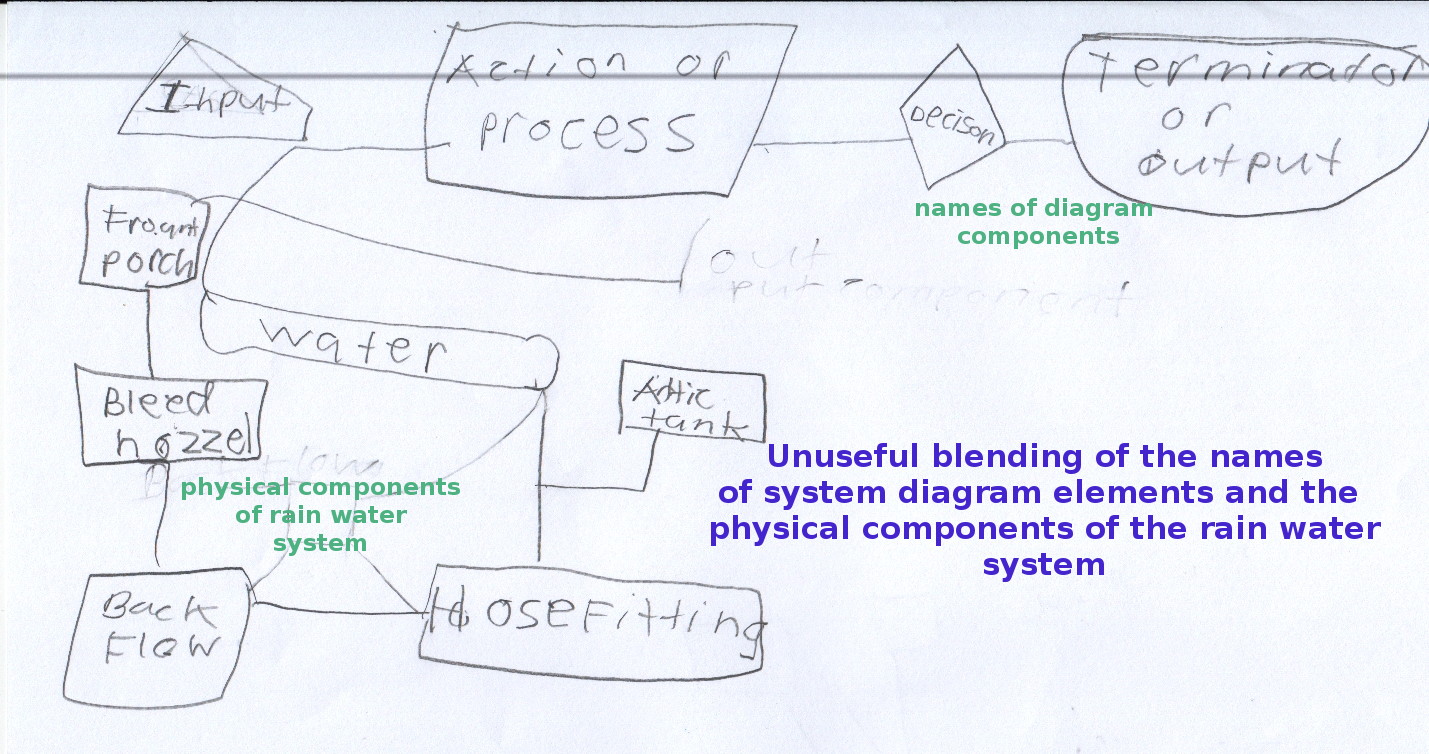
Student proficiency ranged from unable to differentiate system diagram component names (input, choice, output, etc.) from physical components to correctly diagramming each sub-system using the diagram components classifications. |
Impact 1: Request & support the labeling of sub-systems within the core computer component set Impact 2: Impact on teaching: SLOW DOWN! Introduce the component types (Decisions, inputs, etc.) with simple example Impact 3: Impact on teaching:Increase support of more systematic student taking habits |
| Example 2: Under development |
Instrument examples and results
I designed the formative assessment tools in this system diagramming module as the core output of our discrete module activities. The following work samples were produced by students after an hour-long series of steps to learn about system diagramming of components that are tangible (cars and water control systems).
After reviewing all the student diagrams, I can sketch out a range of skills present in the class. The distribution of the results range of skills becomes the spectrum of response proficiency
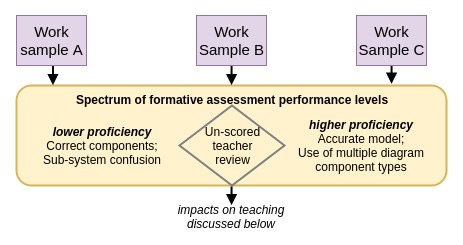
Student work sample A: Lower-proficiency response
Student work sample B: Median-proficiency response
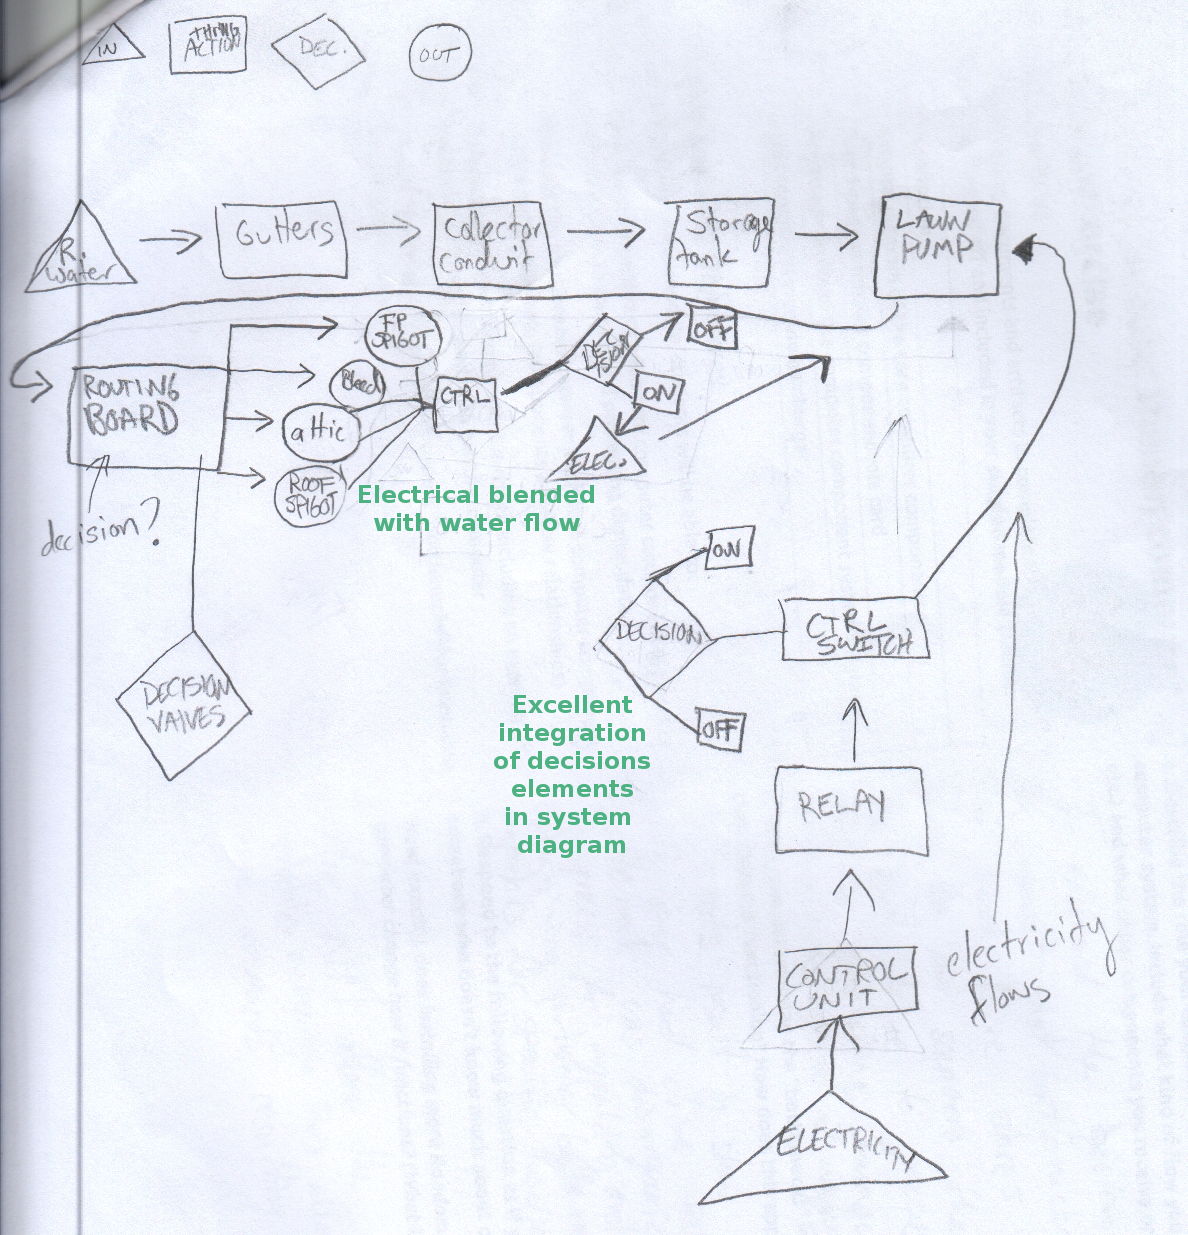
Student work sample C: Higher-proficiency response
Summative assessment profiles & student work artifacts
Summary of Summative Strategies
| Tool Use Example | Summary of data | Impact on course execution |
|---|---|---|
|
Example 1: Identifying flows in system diagrams |
||
| Example 2: Method calls in Java |
Instrument examples and results