
311 Vector Digitizing Project
wb_incandescentIntroduction
The goal of this project is to apply vector digitizing and analysis tools to create and defend a proposed map of 311 high priority service districts to the Citty of Pittsburgh.
Project Context
The City of Pittsburgh's 311 department processes and routes hundreds of thousands of citizen notice/complaint calls. This project's dataset includes almost a half million individual 311 ticket records, each spatially stamped.
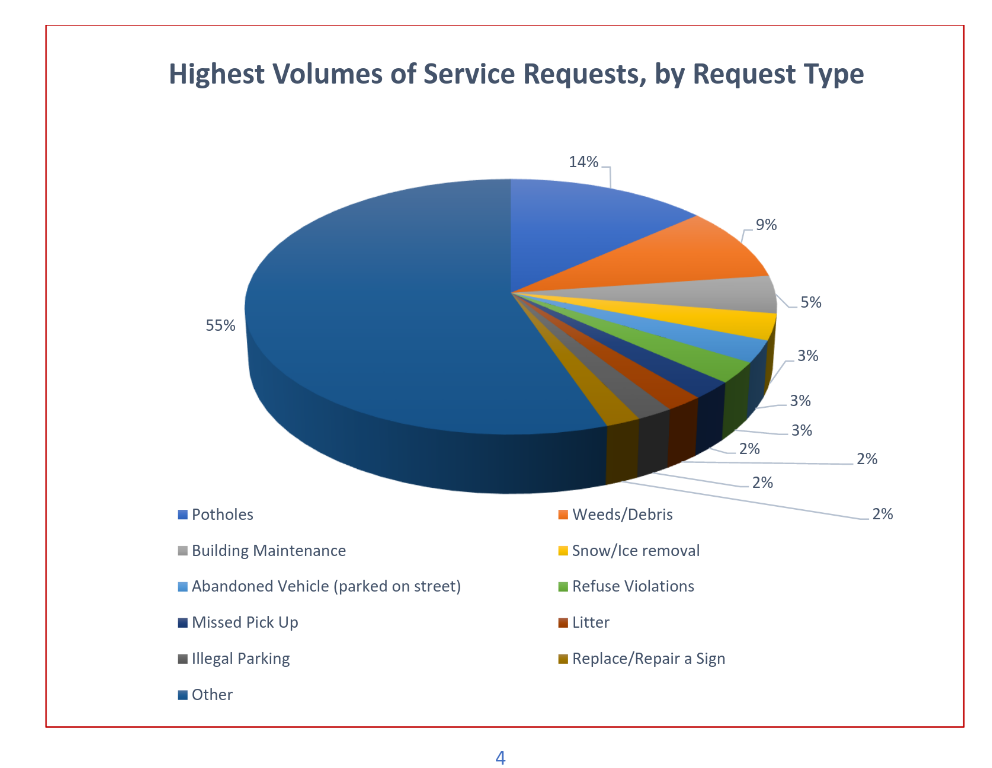
CCAC Python 2 Student Lisa Nydick analyzed the 311 dataset in the fall of 2019 and assembled this slicing of calls by type:
Your Project Task: Create Priority Zones by issue type
Recent public management strategies suggest that dramatic service gains can be achieved by identifying service priority zones to which resources can be targeted in a strategic and tractable fashion to enact quick, forward progress on a single issue domain. This service model is in contrast to an ad-hoc allocation method in which resources are directed to the "most urgent" requests, regardless of their relationship spatially to other 311 complains.
City managers are seeking recommendations on bounded sub-regions of the city of Pittsburgh which can benefit most from concerted attention to a citizen complaint issue type, such as potholes, dilapidated building maintenance, tree trimming, etc.
wb_incandescentResources
wb_incandescentProject Specification
purpose |
Apply digitizing skills to a spatial data analytics model client problem |
step 0: study area prep |
Use an outline of the City of Pittsburgh, or the neighborhood layer, to clip the 311 point layer, thus exclusing the randos in Ohio and the mis-coded points lying off the coast of West Africa. Use the filter tool in the attribute table to only display a sub-set of the 311 calls, perhaps by category, perhaps by date, or both. Remember, if you select features by filter, you can right click the layer and choose Export >> Save Selected Features As to create a new layer with only your focus featyures. |
requirement 1: Visualize 311 Data |
Read in the CSV file provided in project resources into a QGIS project. The Pittsburgh neighborhoods layer may add useful context, especially as a bounding of the city's jurisdiction. Browse the data--it's a lot of points--and generate a small set of figures in a print layout showing the extent of the 311 data by type of request, or any other relevant field. The goal here is to acquaint yourself with the distribution of the data before generating your priority districts. |
requirement 2: Digitize service area polygons |
Based on your parsing of the data from the previous requirement, coordinate with your group to generate one or more layers of polygon features which depict your recommended service priority zones for each major type of 311 call. Check out the analysis tools section below Assign your service priority areas to a given department of Pittsburgh City based on your use of spatial analysis tools inside QGIS. Aim to recommend at least 1 service priority zone to at least 6 different city departments. Note that Lisa's analysis of 311 calls can direct your work. |
requirement 4: Defend your service zones with data |
Create a pretty map layout portfolio to show your proposed zones. Include features, figures, counts, shadings, etc. to defend your zone's boundaries. Include brief written descriptions of what the reader is to learn from each of your map figures. Create a sub-directory in our shared cloud drive to upload your work. |
wb_incandescentAnalysis tool ideas
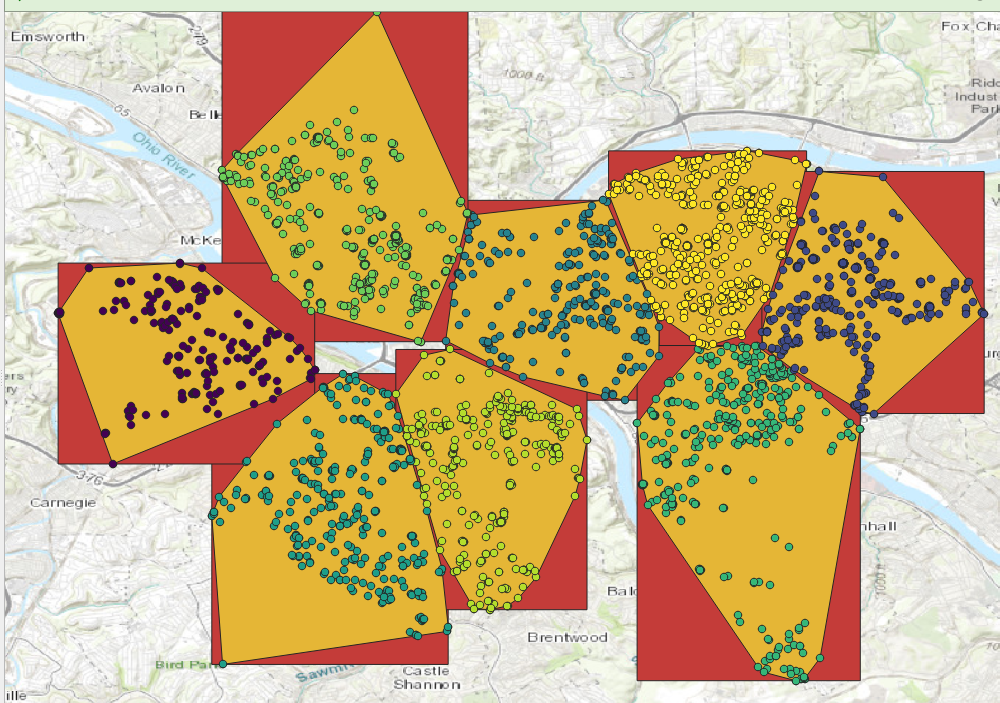
K-means clustering
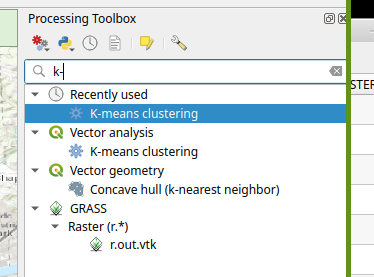
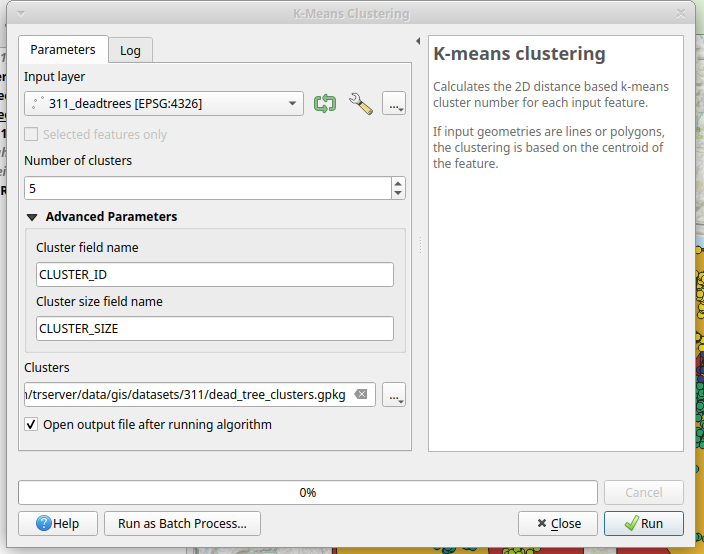
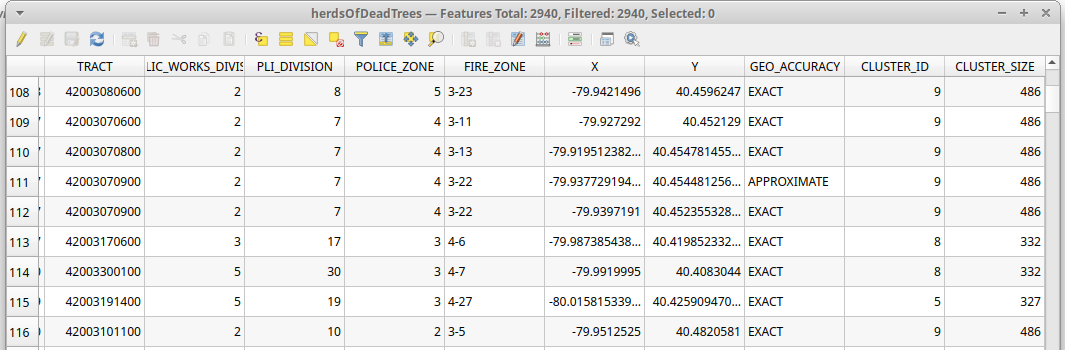
K-means clustering tool will group points based on a gravity body physics model. Access
Access this tool by navigating to View >> panels >> processing toolbox >> search for k-means and click the result to pull up the dialog. Here are screen clips of Eric's demo of this with all the dead tree 311 calls in the dataset.
Kernel Density Estimation (i.e. "heat" map)
This is a raster layer tool which will generate a pixel grid whose values correspond to the outputs of a mathematical model which attaches a weight and a radius to each point in a vector layer. Overlapping heat zones from each point are aggregated to show the relative intensity of points in a given area.
Access this tool via View >> panels >> processing toolbox >> search for "kernel" and select "heatmap"
You'll want to do some tinkering with the settings for this algorithm and compare the outputs from several variations of inputs to choose an optimal configuration. The mathematical model underlying this tool is very complex, meaning adjusting the input parameters strategically but not mathematically is an acceptable tuning method.
Here are the sample parameters Eric used to generate the following heat map:

