Check this page for updates on upcoming classes, our learning goals, and the lesson modules we'll use to get there.
Data camp 2018: Daily session guides
Friday, 13 July 2018
Primary data analysis and map Department of Health updates
live_helpGuiding questions
- What claims can we confidently make based on both qualitative and quantitative data?
check_circleLearning Objectives
- Code field data using an open coding technique
- Compose claims that respond to one of our core questions, preferably one with existing or to-be-generated data to back it up
Phase 0: Setup your workspace
Open firefox browser and navigate to technologyrediscovery.net. Navigate to this page--the daily session guides.
Then load up the following tools on your system:
- drive.google.com >> 2018_youthTobacco >> {your personal directory}
- Open your researcher profile google doc
- Log into your carto.com account
- Open the map you've created where we're putting survey data
- Drag the tab containing this page into its own browser window and drag it to your extra screen.
Phase 1: Audience data trees orienteering
Goal: Make judgments about a source's best-fit audience while navigating an actual orienteering course using clues and directions and the compass rose to find one's way through their data branch
Phase 2: Round out researcher profile
Please have the following tasks complete before leaving on Friday
- Your first carto map has been published ( Check here for how to publish)
- You researcher profile contains personal intro content (only professional-ish stuff, please)
- Your profile contains a work process log of your steps up to the end of today (probably about 12 steps--be as specific as possible!)
- Your profile contains a link AND screenshot to your first carto map. Use the program called "screenshot" on your computer to capture a screen shot of your map
- Your profile contains a section called: claims and data which includes 1-2 core claims (statements that can be backed up with evidence) and the evidence to go along with them.
Wednesday, 11 July 2018
Topic: Audience analysis and preparing for field day Thursday
live_helpGuiding questions
- How do sources adapt to their intended audience? How can we adapt what we make to our intended audience?
check_circleLearning Objectives
- Categorize sample data bits into their best-fit audience and defend the classification to each other
- Compose claims that respond to one of our core questions, preferably one with existing or to-be-generated data to back it up
- Fully prepare for our field data gathering day on Thursday: Make to-do lists, create online map to guide work on Thursday, etc.
Phase 0: Setup your workspace
Open firefox browser and navigate to technologyrediscovery.net. Navigate to this page--the daily session guides.
Then load up the following tools on your system:
- drive.google.com >> 2018_youthTobacco >> {your personal directory}
- Open your researcher profile google doc
- Log into your carto.com account
- Open the map you've created where we're putting survey data
- Drag the tab containing this page into its own browser window and drag it to your extra screen.
Phase 1: Audience data trees orienteering
Goal: Make judgments about a source's best-fit audience while navigating an actual orienteering course using clues and directions and the compass rose to find one's way through their data branch
Phase 2: Finish first-draft map and plan for Thursday
Please have the following tasks complete before leaving on Wednesday
- Your first carto map has been published ( Check here for how to publish)
- You researcher profile contains personal intro content (only professional-ish stuff, please)
- Your profile contains a work process log of your steps up to the end of today (probably about 12 steps--be as specific as possible!)
- Your profile contains a link AND screenshot to your first carto map. Use the program called "screenshot" on your computer to capture a screen shot of your map
- Your profile contains a TO-DO list for your field time on Thursday with goals for what data to gather and how you'll record it
Tuesday, 10 July 2018
Topic: Producing first-draft maps & strategizing
live_helpGuiding questions
- We can put a dot on top of any store we surveyed. What survey data can we visualize that will help us explore answers to our core questions?
check_circleLearning Objectives
- Explain what the computer is doing when it's geocoding addresses in a flat data table
- Feed a correctly assembled flat file of data into carto.com and run its geocoding tool
- Apply the geocoding analysis tool in carto.com to plot points for as many data entries as possible.
- Active the style-by-value system in carto.com to visualize one or more columns of survey data
- Make summary statements about an inquiry question using the visualized data
Phase 0: Setup your workspace
Open firefox browser and navigate to technologyrediscovery.net. Navigate to this page--the daily session guides.
Then load up the following tools on your system:
- drive.google.com >> 2018_youthTobacco >> {your personal directory}
- Log into your carto.com account
- Open the map you've created where we're putting survey data
- Open your researcher profile google doc
- Drag the tab containing this page into its own browser window and drag it to your extra screen.
Phase 1: Questions, claims, and data scavenger hunt
Goal: explore questions, hypotheses, and data that relates to both in an active, search-the-grounds kinda way
- Browse the activity space (the entire shop) for core questions that are related to our study. Read them to yourself. Jot them down on your clipboard, perhaps.
- Using clues or just your eyes, gather up envelopes from around the house. Each envelop contains a claim or a piece of data that relate to at least one of the core questions around the house.
- Read and study the contents of the envelop. Mark it as either claim or data.
- Locate one of our core questions and attach the claim or data to the space on the wall around that question. Take a moment and review any other claims or data attached to the core question: we want to connect data to claims. We also want to throw out claims for which we have no data to back it up.
- Once all the envelopes have been found, choose a big question that interests you most, and connect data to claims they relate to. Mark any claims that have no backing data as an unsupported claim
Extension ideas
- For each of the core questions, verify each piece of data using its source. Rate the reliability of the data based on its precision, who gathered the data, and how it was gathered.
- Write a summary statement on each data card which answers the question: what does this data show us?
- Review the core question and any claims attached to it. When we take all the claims together, how persuasive or interesting of an answer do we have so far on the wall?
- What additional pieces of data would we want to gather to either increase support for claims that are already on the wall, or could support claims we think we'd like to be able to make.
- Create a blank data card for any pieces of data we'd like to assemble for this core question. Write what we hope the data will explore on the card itself.
- Assign each blank card to a participant in the project.
Phase 2: Start work on individualized project components
Each student has developed a particular focus question for their own work which guides the map-making strategy and how to allot time during general work periods. Adult supporters teamed up with individual students or small groups of students working on related tasks to provide facilitation and pointers as needed.
Teacher reflections/journal
The following bullets were written by Eric Darsow after this session and before Wednesday's as reflections and ideas both for my own documentation and research and to provide mental raw material to other teachers, planners, and students:
- Creating the data scavenger hunt--even with very simple search-and-destroy clues--was extremely effective at injecting energy into the session. By inviting the students to roam free around the property including the front yard, back yard, and all the rooms created a sense of shared space instead of students-in-crazy-white-guys-house. Suggestion: find a way each day to facilitate the students not only moving around, but moving around purposefully.
- Peer-helping was mixed today: Zhante and Keith seemed unsure of how to help one another through the preparation process for geocoding points using address. During my introduction of the two with the proposed goal of Keith helping Zhante, Keith voiced reluctance to the helping, citing poor memory about what was done. Reaction: have profiles up and encourage step-by-step documenting of what is down, down to the clicking level. This will then become a tool for one peer teaching/helping another and likely increase the effectiveness of the peer teaching.
- Talk to the group more explicitly about working with each other: helping versus rescuing, etc.
- Having visitors come in during the session (Dr. Jones, Olivia) is extremely positive so long as they are engaged and relational with the students. Teachers must facilitate the connecting of adult visitors who are dropping onto a moving train with some students who are willing and comfortable explainers of what has been done so far in the project, and what is underway at that very moment.
- Work time: still not very much self-directed prep. Glen was productive because Kierra was sitting right with him. Trying to cook up tasks with minute revision suggestions with Zhane was not effective at building a sense of mastery and ownership over her components of the project. Zhante also would revert back to phone use immediately when stuck technically: need to support learning how to find help independently. He finds help for the video game, how about for spreadsheets? What search & reading skills can be harnessed for this purpose?
Past daily session guides
Friday, 6 July 2018
check_circleLearning Objectives
- Organize data about observed things (people, stores, etc.) in data tables and declare a data type for each column/field.
- Create a useful work process log that allows for returning to previous work without losing ground.
- Rename table fields for export and specify data types for each column.
Phase 0: Setup your workspace
Setup your computer workstation to have carto and google drive open in separate windows. Move windows around using the top bar so that you have the most desirable windows in the most desirable screens.
Phase 1: Start/continue your researcher profile and work log
Instead of having all of our profiles in the same document, you're invited to create your own profile document inside your directory on our google drive. Follow these steps to make this happen:
- Log into drive.google.com using your google account
- Navigate to our shared 2018_youthTobacco directory. Then find your own directory inside that one.
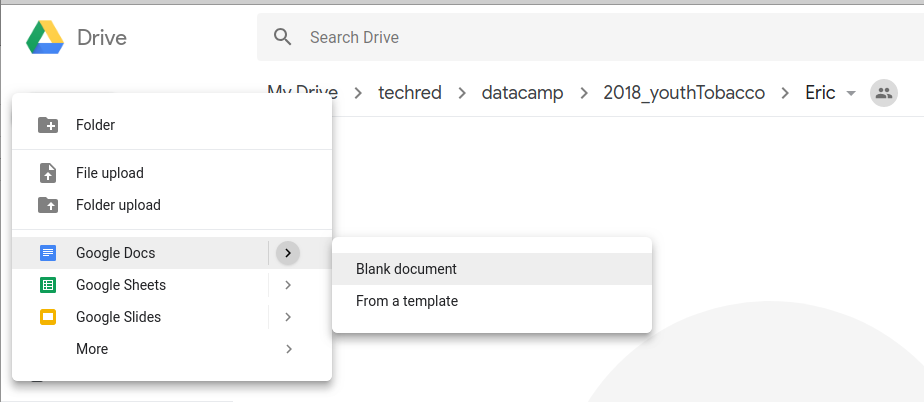
- In your own google directory, create a new blank google docs document.
- Rename this document something like "[Your name] researcher profile"
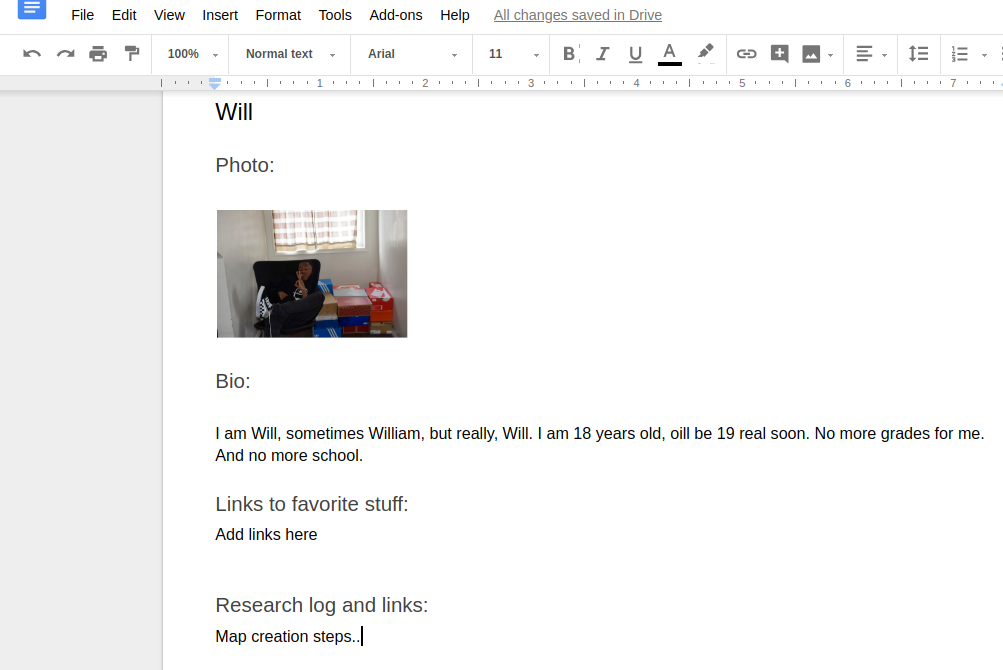
- Use the image below of Will's draft profile to build your own. Include a photo of yourself, a few sentences about yourself, and any links you think are meaningful.
- Add a new section of type "Heading 2" called "Work log". Locate the headings by clicking the down arrow in the style select menu, which is probably displaying "Normal Text" by default.
Creating a new blank document in google drive
Will's sample profile
Phase 2: Building and working with data tables
Let's make a data table that contains information of various types about our group. Each row represents a on object, or in our case, a person. Each column represents something we want to store about this object.
- Brainstorm columns for the table. The header of the column should be concise and have no spaces, NOT start with a number, and contain no weird characters (like ? or &)
- Decide on an appropriate data type for each column's data: String (text), decimal number, integer, or boolean (true/false)
- Take turns populating a row of the table for each piece of data, or in our case, a person.
- Transfer this information to a spreadsheet. Name the current tab: data_table. Create a new tab and name it: data dictionary.
- Back on the data table tab, populate the table with the information we brainstormed as a group.
- Now select only the header row (row 1) of the table. Copy this set of cells.
- Now switch to the second table called data dictionary. Select cell A1. Now go to edit >> paste special >> transpose. This will copy your header row as values in a single column! Handy!
- Add a new row above your column of values, which will be the header for this new table. Call this column "table fields" and make a second column called "data type".
- Now populate the data type column with the appropriate data type for each chunk of information you stored about each person.
Teacher reflections
Written by Eric Darsow before Monday's session (the next session)
- Major oversight: Trying to "force-fit" students' questions into ones that sound like the ones I think I'm supposed to train them for: geospatial related questions. Revised approach: draw out all questions. Post all thoughtful questions. Organically draw out which ones are most important. Use a map, or not. The question should come from inside the student.
- Missing students: Ja'aden and Glen. Major energetic drop. The students came over an hour late on Monday. How to keep momentum up?
- Great need for providing the "why" behind computer skills. When asked about why spreadsheet skills might be necessary, answers included: working for Apple making apps. Writing programs. Secretary. No mention of use in non-programming applications. Major need: discussions and examples of use of computer skills in jobs/professions that aren't in the tech industry.
- Dramatic need for more moving around. Denise mentioned looking for an AV teacher. Steps to convert the upstairs front room into an A/V studio.
- Finally being able to create value-colored maps in Carto probably took too long. Shouldn't take until Friday to geocode. Should tinker more with property data, etc., in Carto on Day 1 or two. At least the racial dot map in PGH was a nice and interactive activity.
- New design idea: attach data to questions. Find data around house. Discuss while standing and working with hands.
Thursday, 5 July 2018
check_circleLearning Objectives
- Ask deep questions that we care about related to topics of our interest. Assemble data that can help us answer those questions
- Effectively navigate between local and cloud storage to manipulate data
- Create sharable maps in carto.com
listLesson Sequence
Phase 1: Organize your workspace
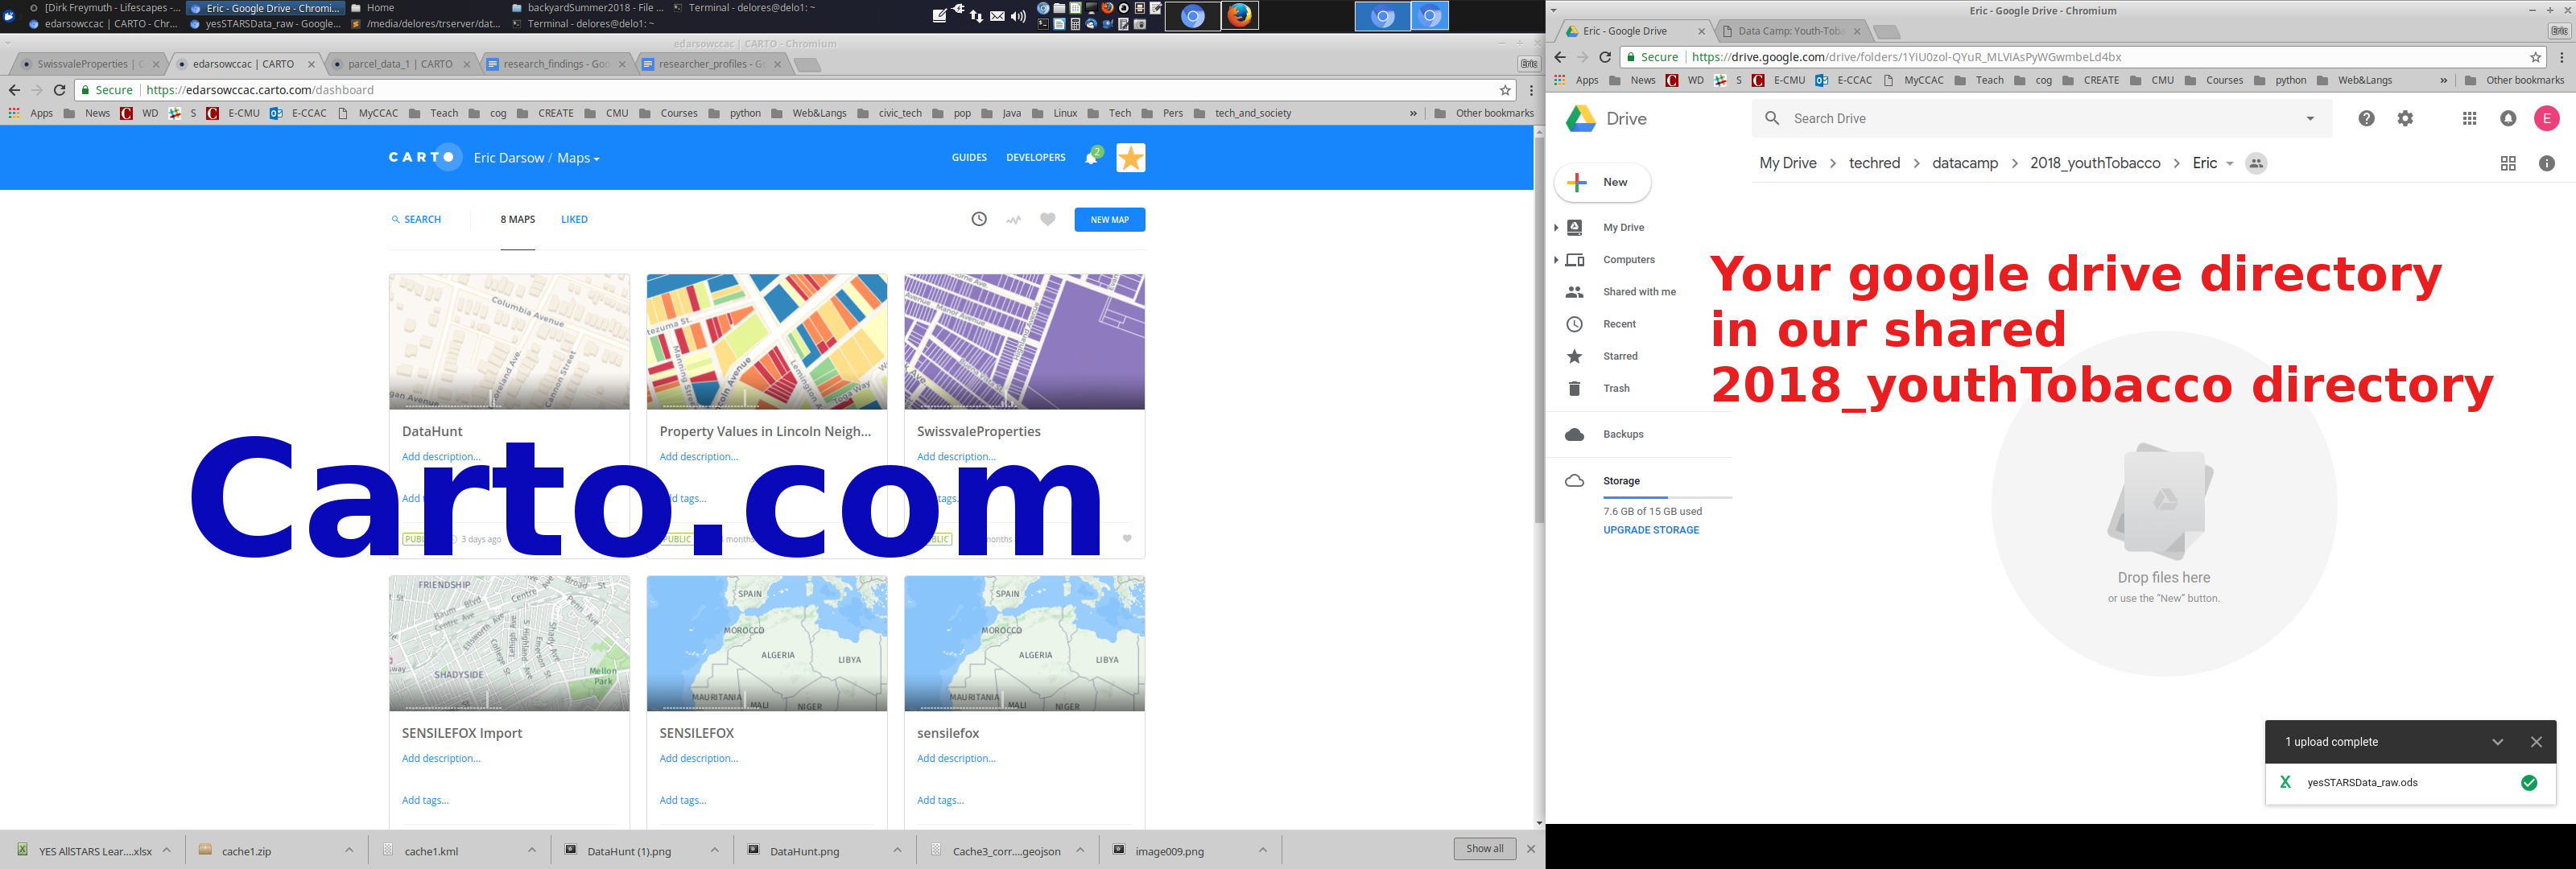
We use multiple tools when we work with data. Those tools need to be organzied so we can focus on the task at hand. Setup your workspace using your two screens to look like this:
- Keep this guide open in its own tab. Add a new tab to this FireFox window with Control + t. Then in this new tab, load drive.google.com using the google account you used on Tuesday.
- Navigate into our sahred directory called 2018_youthTobacco. Then find your own personal directory named after you! Open that.
- Open a who new FireFox window with Control + n. Clicking and dragging on the top bar of your new FireFox window, move it to your primary computer's work space. Now navigate to carto.com and log in to your account. Just let the window sit there with your list of maps displayed on your home screen.
- Your work station should now look something like this:
Phase 2: Plotting store survey location points in Carto.com
- From your carto home screen, click "New Map" which is in a blue button in the upper right corner. After clicking "new map", a screen called "select dataset" appears. Select "create empty map" also in the upper right.
- Now you should have a blank map called "Untitled map". Rename this map using the three dot menu next to "Untitled Map". Name it something like "STARS survey data [Your name]".
- Open your STARS google sheet spreadsheet open the window on your main computer. We want to be able to see your carto.com map and your google spreadsheet STARS data at the same time.
- Now, back in Carto.com, create a new point layer in your STARS map. Do this by clicking "+ New Layer" on the left side bar. You're given a screen called "add a new layer". Select "ADD AN EMPTY LAYER" in the upper right.
- Rename this layer to be something like "Stores surveyed by [your name]"
- We now need to edit this new, blank layer. Click the three dot menu next to your new layer name >> edit data
- Your blank layer should now be open. As we did befofore, you'll click the point symbol to start adding points to your map. Points are the left most symbol in the little group of three buttons. Your system is now ready for you to click the map to plot a point.
- But what to plot? We want to plot the location of the stores you surveyed. So, use the store address from your spreadsheet data to locate the store correctly on the carto map. You may want to use google maps to help you find the store, then locate that position in your carto.com map.
- After you have plotted that one store, record data about it in the boxes that appear in the left side pane, such as the store's name and address.
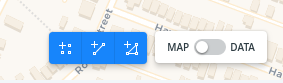
- Click the Map-Data slider in the lower left to see that you have a point that shows up as a row in your data spreadsheet.
- Enter the location data for 4-5 stores that you personally surveyed.
|
|
background |
Some folks suggest one of the best ways to improve race relations is to desegregate our neighborhoods so there's more mixing between people of different races. |
question |
What neighborhoods in Pittsburgh are the least segregated--meaning which neighborhoods have the largest blend of folks of different races?
Where might you locate a new school?
|
Finding an answer
- Load this dot map of racial breakdowns in Pittsburgh. This map contains lots of data, so be patient with the loading time.
- Explore the map some: What do the colors of the dots mean? What layers can you add or subtract?
- Search for an answer to this question. What data did you use to arrive at your answer? Create a screen shot of the location on the map that you used to back up your data, and copy and paste it into your google doc.
- You may also want to view the national racial dot map, which has gone "viral" among the data geeks.
Phase 3: Data about your interests
- Brainstorm with the group a deep question related to one of your personal interests that isn't a simple fact lookup. Which basketball team has the best defense? Which video game company is most profitable?
- Create a section in your profile google drive document that lists the question you're investigating. Write the question on a note card as well so you can see it in front of you at all times. (See your goal!)
- Dig into possible data sources to back up your answer to this question. Copy and paste the data you're finding into your profile google drive document.
- Share your findings with the team. Does anybody dispute the data you used to back up your answer?
Didn't get to this on Thursday
Phase 5: Bringing our STARS data in our carto.com maps
Once we have the store locations plotted, we're ready to start attaching meaningful data to these points.
- With your store map open, toggle to the data sheet view in the lower right corner of your map. You should see a row for each of the store points you plotted.
- We want to enter the data table editor. CLick the blue link underneath the name of your layer: this is a link to the table's data viewer. The default name of the table is probably something like "untitled_table_X".
- You should now have the table open in its own window. Rename the table to be "STARS survey points".
- Return to your spreadsheet of data in Google Docs and identify a few columns of data from your survey that you think will help us discover patterns in the survey data. Choose a data type appropriate for the columns you want to attach to the points.
- Use the "Add Column" button in the upper right to add a new column. Give it a name. NO SPACES allowed. use_underscores_for_column_names. With a new name, select the appropriate data type.
- Now transfer the data from your selected columns into your carto table. We'll start visualizing that data first thing Friday.
Tuesday, 3 July 2018
check_circleLearning Objectives
- Become confident Linux users: access share resources on a network drive, post content to a google drive, customize workspace, use multiple monitors.
- Use a spreadsheet to clean and manipulate tabular data
- Create sharable maps in carto.com
- Make youth media development plans
listLesson Sequence
Task 1: Spice up your workspace
- Locate some images/symbols on the interwebs thar are cool. Use google image search or any other search engine.
- Copy and paste those images into a LibreOffice Writer document. Add headers or notes about who/what the images are.
- The print that document to a printer called Canon MX920.
- Cut out/make cool what you printed and hang them around your workspace.
Task 2: Get setup on google docs/drive
We'll be using google drive to share documents and files within our team and with the world.
- If you have a gmail/google account, open a new tab in your support firefox window (the one on the extra screen). Navigate to drive.google.com and login.
- If you do not have a gmail/google account, create one. Ask for help if you need it.
- Once you are logged into your account and can see drive.google.com, log your gmail address using the type writer (technology rediscovery) on the trapezoidal workbench. Then Eric will share the entire file system with you.
- If you made a new google account for this step, record your username and password on your little clip board.
Task 3: Join our peer teaching study
- Ms. Denise and I are working on developing a model for youth teaching youth about technology, data, and society. Please join the study by completing this short survey about your experiences in school and with learning from each other. Your answers will all be anonymous and will be used for improving this program in the future.
Task 4: Create your online researcher profile
What we do can matter a lot not only to us but other folks working on similar skills. In order to be effective sharers, we want to become people, not just names or numbers. You each have a page in our researcher profile
- Open our shared researcher profile google doc. Hold down control and click your name. This jumps down to your profile page.
- Take some time to build your profile. Include info about yourself, cool iamges or links to stuff/people you find inspriring or interesting.
Task 5: Cleaning up data from our STARS survey
- Open our shared google drive that you should have been granted acceess to by Eric.
- Open the file called "yesSTARSData_raw". Navigate to file>>make a copy>> and save a copy for yourself in your name directory in google docs.
- Rename the file once its open on your directory with your name int the title
- First, we want to find duplicate surveys. Do this by learning how to sort the table by column. We are also going to learn to find our own resources for doing stuff on the computer. Open a new tab in this browser window and search for "google sheets sort table by column". Browse the first few matches and look for a tutorial guide that look comfortable ot you.
- Dedicate 2-3 minutes to just read the guide. Don't start doing it right away. READ so you know what's going on.
- Now try sorting the data by store name and then by store address. When you find what you think is a duplicate survey, highlight one of the two entries in a color of your choosing: We'll likely remove this from the survey.
- Compare the data in the two duplicates. If the data are the same, delete one and move on. If the data are different, talk with a friend about which data seems more accurate and why. Delete the survey data row that is least accurate.
cakeProducts to Produce
- Make a list of the steps that you took today in your researcher profile. Make a header with today's data and make a numbered list of the steps you took. Imagine you got it in the head by a cocunt and forgot everything you did today: make it specific enough that you could reproduce your work.
languageInstructor reflections
Noted within 3 hrs of session ending. (Eric/Xander Darsow)
- More support needed to craft search strings intended for a computer instead of a human. Grab history from browsers and pull actual search strings.
- Must discuss media use before grabbing history for anything but in class support.
- Task 1: Mounting surfaces in workspaces. Coat in packing tape before hanging. Create pin strips.
- Task 3: 7/8 had existing google accounts and could access easily. 4th was comfortable opening a new account.
- Examples screen shots of various web pages to type in. Do a lot more direct typing in of web addresses.
- Disable auto search in firefox?
- The not building out sort instructions worked great. Coach how to search. Rely on helping students find stuff.
- Most studentgs completed through task 5. Even fastest working student just started into Task 6: mapping in carto.