7-SEP'21
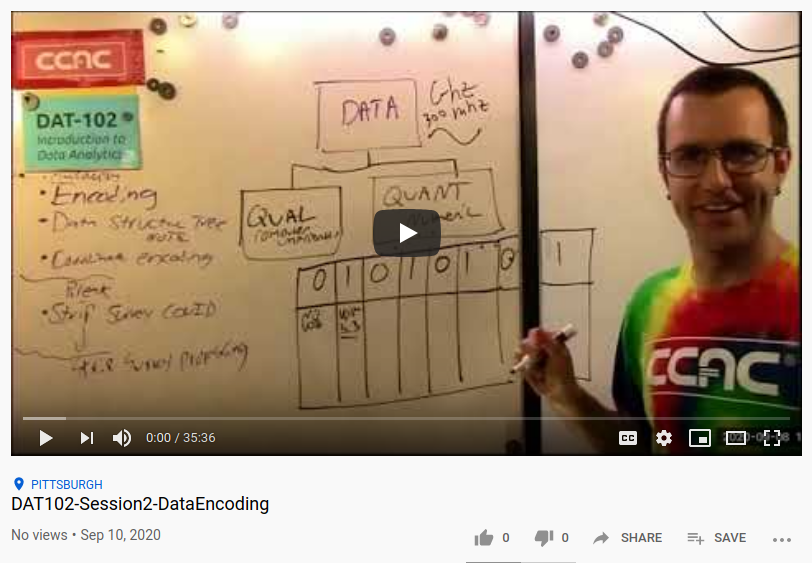
Session FA21 Recording
Introduction to data analytics
Further optional reading
Familiarize yourself with the range of data types provided by Python environments.
- TR.102.DS.3.A - Decompose the data analytics field
- TR.102.DS.1.A - Data Tables - Creating: Create a data table with logically assigned types for each column and a unique identifier for each row
Step 1: Brainstorm a strip survey
Please develop a "strip survey" containing a categorical question and a opinion/spectrum question. Compose the tiny survey in a text document have your document handy when class starts. DO NOT adminster the survey to anybody. No need to up load it; we'll do it in class.
Step 2:
We'll be using google drive for sharing work. Please prepare to share a google account address with us next week. If you'd like to make an anonymous account for use in this class, you've got a week to do so.
14-SEP'21
FA21: Recordings
Recommended pre-reading from textbook for next week
Lock-5 Stats book, ed. 1, Ch. 2, sections 1-4 only (sections 5-6 explore two quant variables which we'll cover later)
- Broadly Classify data analytic artifacts/products/displays (Quant/qual/categorical/textual)
- TR.102.DS.3.C - Continuous & categorical variables
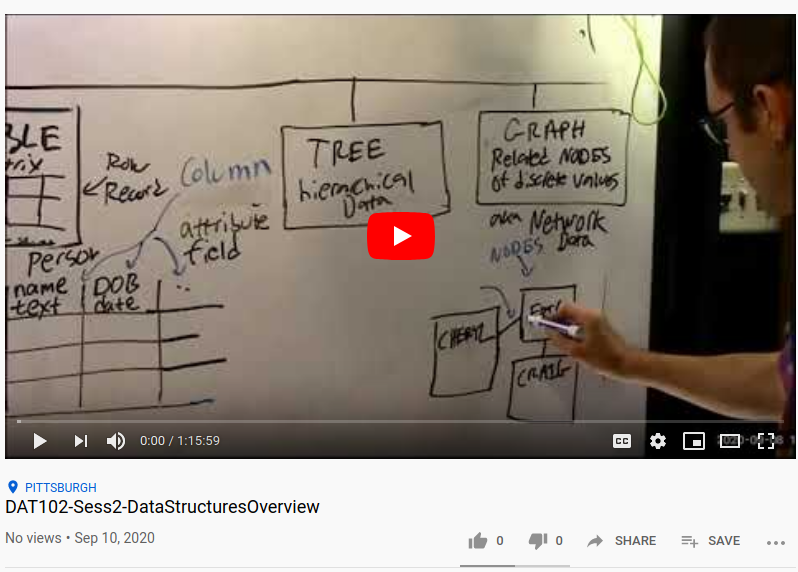
- TR.102.DS.3.D - Data structures (list, set, stream, table, graph, tree)
- TR.102.DS.3.E - Analytic modes: describing, modeling, predicting
- TR.102.DS.1.B - Data Tables - Converting: Export and import data tables in .xslx, .ods, .csv formats
TODO for Fall 2021
Create your template response in your google drive directory by Thursday, 16-SEP'21 at midnight
Complete ALL peer surveys by Monday, 20-SEP at Midnight
- Log into your google account registered with Eric. Nav to drive.google.com
- Click: shared with me and find the DAT102_fa21_masterShared directory
- Then enter the directory: fa21_stripSurveys
- Make a new folder whose name is your firstName_surveyTopic
- Inside your subdirectory, create two more folders: 1) folder called "Admin" to store your template and analysis. 2) Folder called completed surveys
- Inside your survey subdir make a template drawing: Click New >> More >> Google Drawings
- Use the drawing tools (the text box tool, and the line drawing tool on the toolbar) to create your cateegorical question and your spectrum question. For the spectrum question create a horizontal line and label the end points with extreme values.
- When you template is solid, right click in the drive >> Make A copy. Now that you have one copy, move your template to admin by clicking and dragging.
- Duplicate your remaining drawing 23 times, once for each peer. Hint: you can hold down shift and select multiple drawings. You can "right click the entire list >> Make a copy" and this will multiply your copying rate.
- The files probably have "copy of copy of..." at the start. Clean these up by right clicking >> rename and give each copy a unique ID number of your choosing. Could just be 1, 2, 3, 4, etc.
- Double check you've got a folder called "completed surveys"
- By Monday 20-SEP'21 @ midnight please have submitted responses for each of your peer's strip surveys in their respective directories. ALSO: take your own survey!!!
- No need to do any entering of data into a spreadsheet until next week, as we'll do a brief overview of spreadsheet functionality in class.
21-SEP'21
FA21 Session Recordings
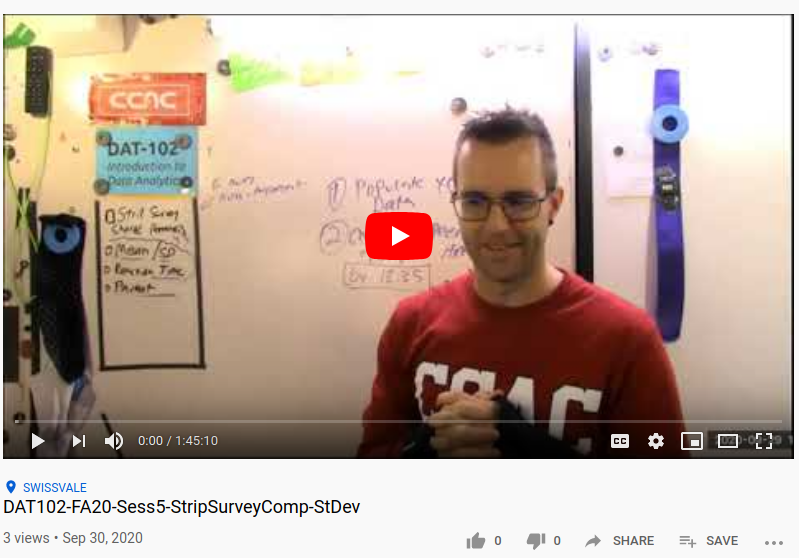
Strip survey analysis
For next week
- Create a new spreadsheet in admin folder, name it without spaces in the ttle
- Create a sheet (i.e. tab) for your raw data table, and a sheet for your data dictionary. Use Eric's sample inside his PAUL+LORETTA
- Populate your raw data table sheet with responses from your peer surveys. Assume all folks have taken the surveys that want to by Midnight Tuesday
- Remember to not pollute your columns with asymmetric data. Example: if your column is storing distances from left margin as a number, don't break the pattern and put a text note in a cell in that column. Keep the data values the same type in each column.
28-SEP'21
Session Recordings
Optional links
Summary-based descriptive stats: mean and standard deviation
Extra
FA'21: TODOs
- Compute your quantitative variable: percent of spectrum to left of tick. Use a spreadsheet.
- Code your categorical variable in a column whose values are simple, like numbers or letters.
- Create a box plot for your unsliced responses. Use statkey or a tool of your choice. Upload to a sub-directory in your google drive directory with a descriptive title.
- Add a filter to your data table in the spreadsheet. Sort by your categorical variable. Group sub-categories if needed so n= about 5 or more for your box plots. Create a box plot for each sliced subset of data.
5-OCT'21
Session recordings
Lock-5 Pre-Reading
Edition 1, Sections 2.3 (Spread) and 2.4 (Box Plots)

Begin library section sampling, to be continued next week.

Lock^5 Book sections
Chapter 2, Sections 1-Sections 4
Draw conclusions about a data set based on box plots
Compute the standard deviation of a data set, interpret the results, and make inferences using Z-scores
Wrap a bow on strip survey
- Create a table in your analysis spreadsheet that summarizes the behavior of your unsliced quantitative variable (your spectrum percent) through its center (mean), spread (standard deviation), and box plot figures (median, q1, q4, min, max, and outliers).
- Repeat the process of quantitative descriptions for any sliced groups (collapsing responses as you see fit)
- Using your assemble data, respond to the following analysis question in large text in your spreadsheet: How do the responses to your spectrum question differ across sub-groups of our class (i.e. when sliced with your categorical responses)? To what degree do the data show these groups are distinct in their opinions about the topic at hand?
- Transfer statistics and compute needed values for your record in our master tracker spreadsheet's strip survey tab. Feel free to try all columns, but only columns D-P are targeted for completion this week.
12-OCT'21
FA21 Recording
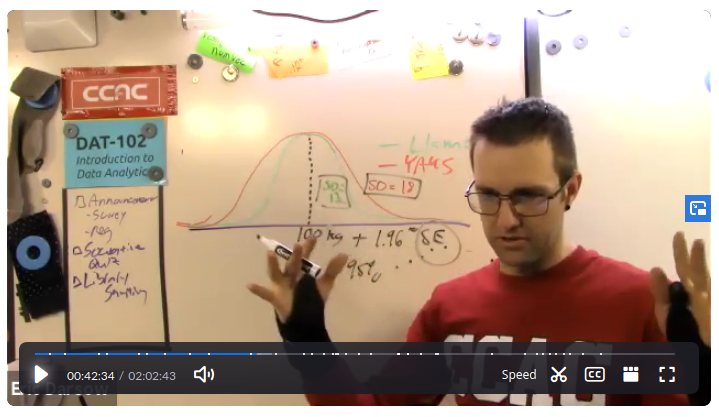
Z-Scores
Due to technical difficulties, we didn't make much headway in Z-scores or the distribution challenge. Stayed tuned for next week!
- TR.102.DS.6.A - Surveys - Designing:
- TR.102.DS.6.B - Surveys - Sampling & Administering:
- TR.102.DS.6.C - Surveys - Analyzing:
Task 1: Strip Survey Analysis
Please populate column D - P in our 'Strip_Survey' tab of our master tracker and please attempt Q through W which are based on standard deviation and box plot comparisons.
19-OCT'21
FA'21 Session Recordings
Z-score continued
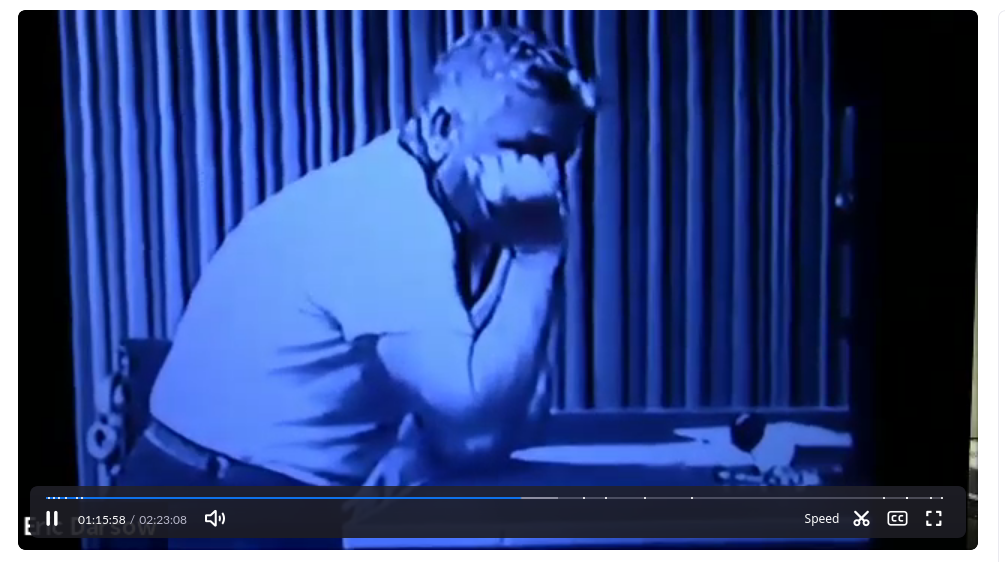
Since we had technical interference last week, we wrapped up Z-scores with a socrative exercise based on the film Phenomenon.
- Compute a z-score from a standard deviation and an observed value.
- Interpret what a z-score means
Complete all columns of analytics for your strip survey, including the beefy final column comparing your sliced groups.
26-OCT'21
Distribution Challenge
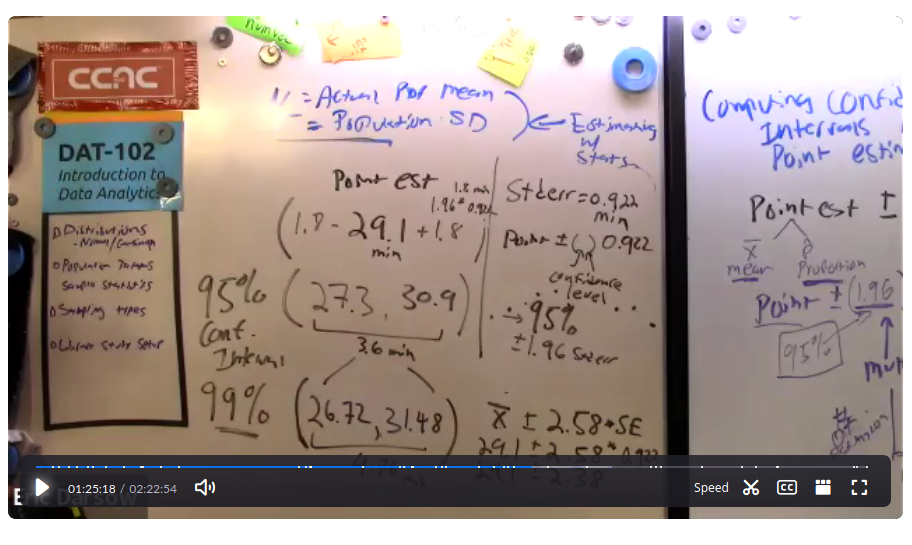
Use the boostrap sampling procedure to make an estimate of a population parameter from sample data.
Complete Column X in master tracker for strip survey
Wrap a bow on your strip survey analysis by writing a comparison of your sliced groups in column X of the master tracker's strip survey sheet (aka Tab)
2-NOV'21
Session Recording
Sampling!
Begin library section sampling, to be continued next week.
Sampling Research
- Sampling 1: Implement the process of making an inference about a population parameter from a sample.
- Sampling 2: Use a statistical package--such as StatKey--to experimentally estimate the standard error of the sampling distribution
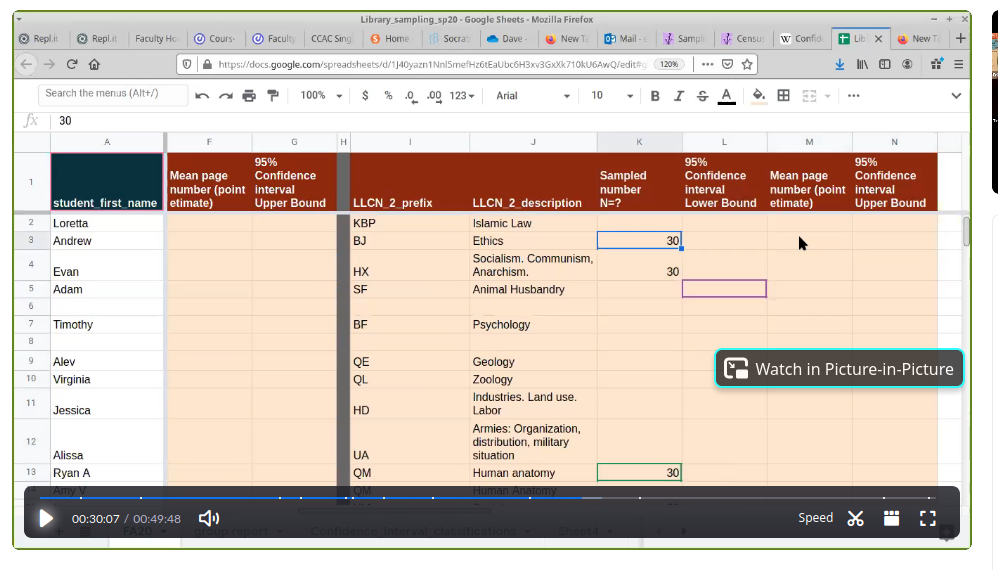
Step 1: Please sample 30 books from each of your two library sections: record the call number, number of pages, and some creative variable for each book in each section. Please create a data analysis subdirectory in our shared google drive fa21_librarySampling subdirectory. Also, share your chosen Library of Congress sections in our class master tracker on the library_sampling tab
Conf. Interval article study
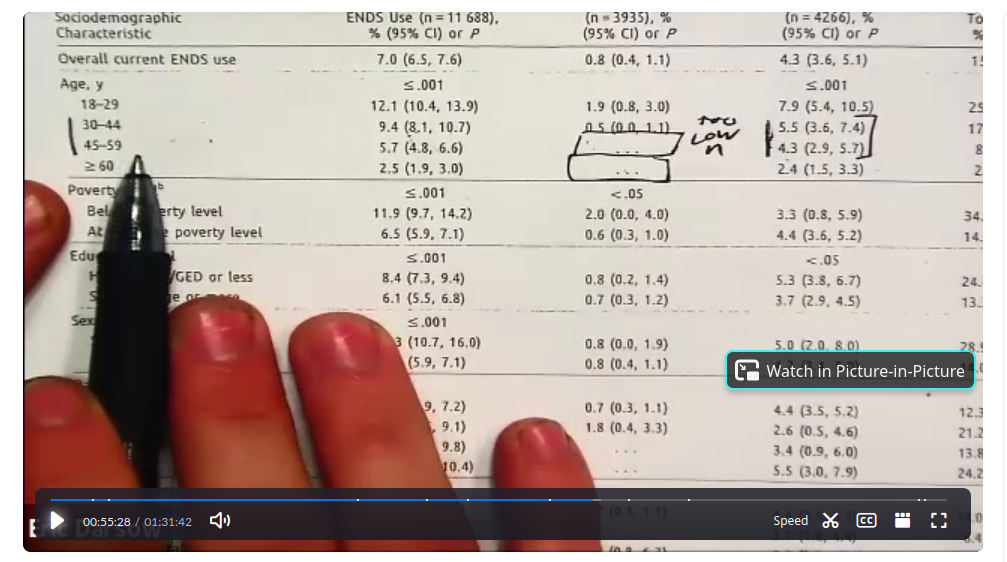
Please study the two American Journal of Public Health articles distributed in class. Prepare to dig into their confience intervals for each sub-population. If you are logged into the my.ccac.edu system, you'll have full article access.
- Law Enforcement Agencies' Perceptions of the Benefits of and Barriers to Temporary Firearm Storage to Prevent Suicide (Feb-2019, Am J. Pub Health) by Brooks-Russell, Ashley; Runyan, Carol; Betz, Marian E.; Tung, Greg; Brandspigel, Sara; Novins, Douglas K.

- Sociodemographic Correlates of Electronic Nicotine Delivery Systems (ENDS) Use in the US (Sep-2019, Am J. Pub Health), by Spears, Claire Adams; Jones, Dina M.; Weaver, Scott R.; Huang, Jidong; Yang, Bo; Pechacek, Terry F.; Eriksen, Michael P. (2016-2017)
9-NOV'21
FA'21 Recording
Review Library Sample Findings
NOTE: Skip hypothesis testing questions/sections
Dedicate a few hours hours to carefully responding to second page's questions 1-6 of the analysis questions from your library sample. Answer these in a google drive doc in your dedicated library sample directory/folder.
See our sampling module, and choose the library sampling mini-project. Upload all your work in our shared google drive (load your google.com account, then navigate to drive.google.com then select "shared with me" in the left sidebar then locate our shared directory for FA'21 DAT-102) for formal submission Be sure to name your files with your public first name and your library section prefixes.
Cross-populate our master tracker spreadsheet with your confidence intervals for both sections. If possible, work up through column N in the master tracker: are your two sections meaningfully different enough in average length to choose one for digitization first?
Target completion for this is Tue, 30 November
16-NOV'21
Fall '21 Recordings
Review of CI Fundamentals Socrative Quiz
Introduce BiVariate analysis
See Lock5 Stats Sections: 2.5: two quant variables with scatter plots
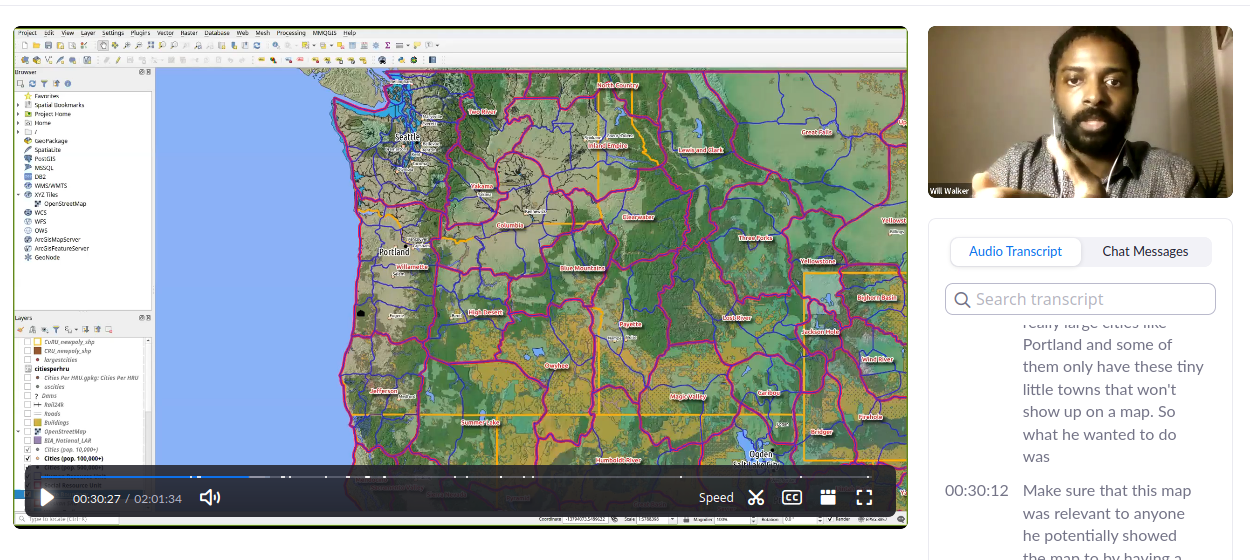
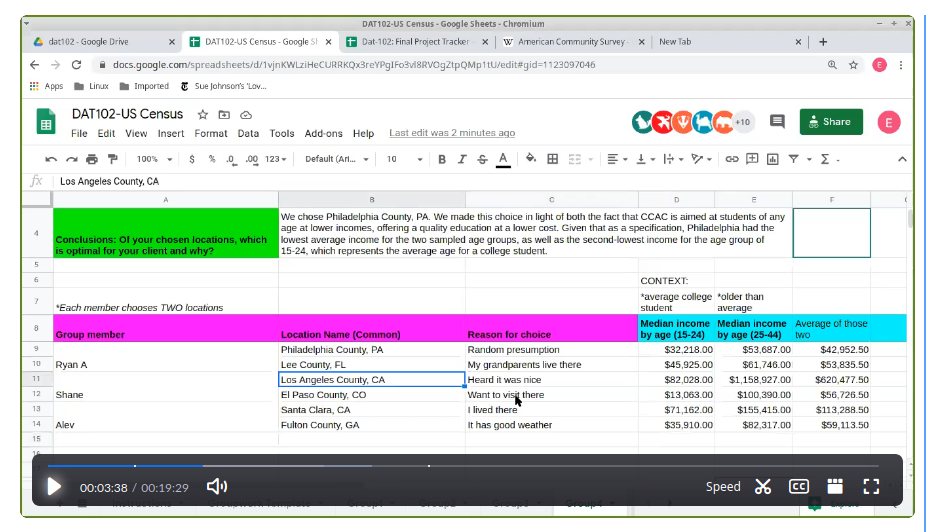
US Cesus and ACS
The longest-running and most comprehensive sample-based data set is the US Census American Community Survey (ACS), the data from which is publicly accessible and incredibly rich.
Review of ENDS article confidence intervals
Log our final project ideas
- TR.102.DS.7.A - Experiments - Designing:
- TR.102.DS.7.B - Experiments - Treatment assignment & Implementing:
- TR.102.DS.7.C - Experiments - Analyzing:
- TR.102.Q.10 - Standard errors
- TR.102.Q.11 - Student's T-tests - Setup
- TR.102.Q.12 - Student's T-tests - Interpretation
Step 1: Study AJPH Articles from last week's homework and Prepare for socrative quiz on conf intervals
Step 2: Populate our master tracker Library_sampling sheet with your library data
Step 3: Familiarize yourself with American factfinder for next week's worktime and propse soe variables of interest to you
Start thinking about your final project
23-NOV'21
30-NOV'21
FA'21: Recordings
Multivariate analysis
See Lock-5 Stats Section 2.5 anb 2.6,as well as our videos
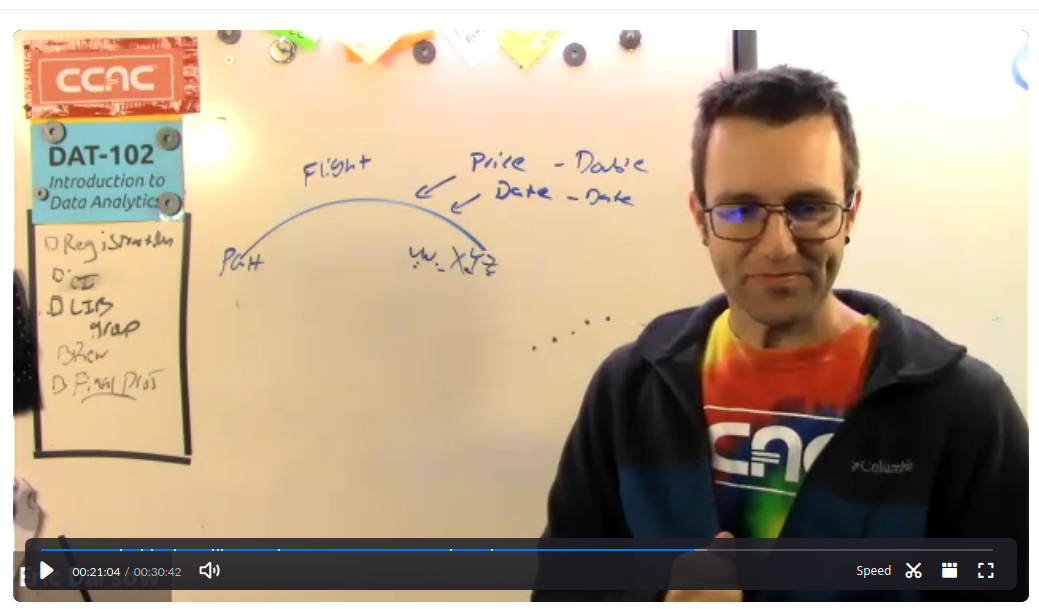
Final project practice and design
Begin final project
OPTIONAL Out of class:
Digest PGH Inquality report
Due to COVID-19 reorganiation, we will be unable to discuss the data and the sociology behind Pittsburgh's Inequality Across Gender and Race Report issued by the Pittsburgh Gender Equity Commission. As you desire, please engage with the report on your own and with others in your various circles. These discussion questions may be a guide for your discussion:
- Review the study's aggregation of smaller racial subcategories into the "AMLON" category. What are the advantages of this statistical approach? Its limitations? Would there be other ways to aggregation races into smaller categries?
- Review the Report's focus areas in the section called "Cultivating Livability." Which of these priorities do you believe are most salient at this time in Pittsburgh? Most data-based? Least data-based?
- Carefully study the comparison methodology in Appendix A. Develop a thoughtful opinion of the author's assertion on page 72, third paragrah which starts: "When outcomes, like grade reten tion rates, are similar across cities they are likely to be driven more by national policies and factors...". Can you think of any indicator patterns which do not exhibit this behavior?
7-DEC'21
Fall 2021 Recordings
Experiments: Mind Food
Randomized Controlled Trials
Final project concept development
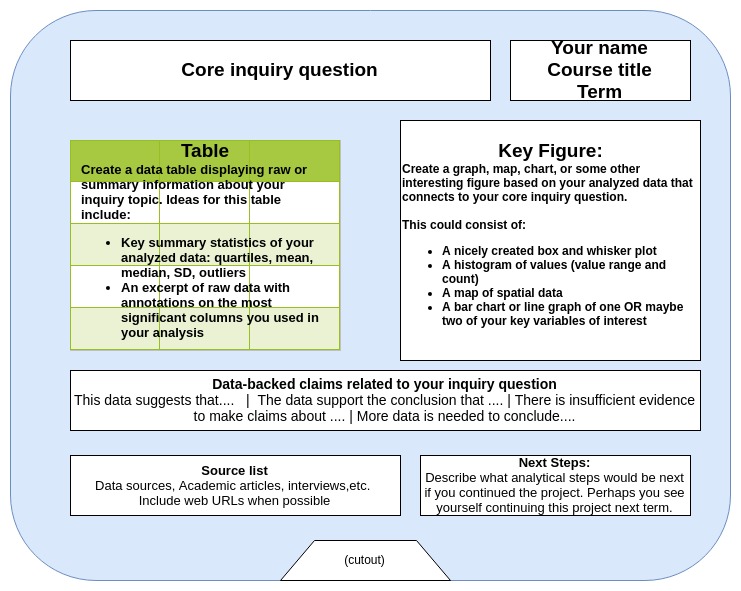
Undertake and document your final project for sharing next week. Create a sub-folder with your first name and your topic of study inside the directory in our shared drive called dat102_sp21_finalProjects
14-DEC'21
FINAL EXAM PERIOD from 1900h-2100h (aka 7-9pm)
CCAC Requires final grades to be submitted to the Database by 10:00 am on 22-DEC'21; Please finish any mop up stuff by 0900h on this date. Please RING Eric at 412.894.3020 if you're submitting close to this absolute deadline to make sure your work gets reviewed.